 |
Learning Resource Centre Monthly Bulletin |
 |
| |
Learning Resource Centre Monthly Bulletin |
|
| New Books |
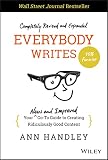 B120196 Everybody Writes By Handley Ann | 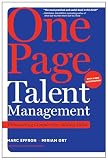 B120218 One Page Talent Management By Effron Marc |  B120208 Jab, Jab, Jab, Right Hook By Vaynerchuk Gary |
| Click Here to learn about the Recent Books added to our collection on different topics of Management. |
| Articles |
| The Spiritual Connection Between Music, Dance, and Divinity. By Jayaram, Sandhya Sankar International Scientific Journal of Engineering & Management. Aug2026, Vol. 5 Issue 8, p1-5. 5p. Abstract :From time immemorial, music and dance have been regarded as sacred forms of artistic expression that establish a profound connection between the human soul and the divine. In Indian tradition, these art forms are not merely means of entertainment but are considered pathways for devotion, meditation, and spiritual realization. Bharatanatyam, with its harmonious blend of rhythm, melody, expression, and movement, transforms the dancer`s performance into an offering to the divine. Through Abhinaya, the dancer communicates deep emotions of devotion, surrender, and love, creating a spiritual dialogue between the performer, the audience, and the divine presence. The integration of music and dance thus becomes a powerful medium through which inner emot ions are expressed and the divine experience is awakened. [ABSTRACT FROM AUTHOR] | |||
| Netflix Content and Viewing Trends Analysis Using Tableau. By Uma, R.;Abhigna, S.;Sravya, V.; Navadhitha, B.; Raju, C. H. Naga International Scientific Journal of Engineering & Management. Jun2026, Vol. 5 Issue 6, p1-5. 5p. Abstract :Netflix is one of the world`s leading streaming platforms, offering a vast collection of movies and television shows across various genres and countries. The increasing volume of digital content generates valuable data that can be analyzed to understand content distribution and viewing trends. This study focuses on analyzing Netflix content using Tableau, a powerful data visualization tool. The dataset contains information such as content type, release year, country, rating, and genre. Various visualizations were created to examine the distribution of movies and TV shows, yearly content growth, popular genres, country-wise content availability, and rating patterns. The analysis reveals that movies constitute a larger portion of Netflix`s catalog than television shows. The United States and India emerge as major contributors of content, while TV-MA and TV-14 are the most frequently occurring audience ratings. The study demonstrates how Tableau can transform raw data into meaningful visual insights, helping users understand content trends and supporting data-driven decision-making. The findings highlight the effectiveness of data visualization techniques in exploring large entertainment datasets. [ABSTRACT FROM AUTHOR] | |||
Do you wish to explore more articles? Just try using one of the full-text databases below!
| |||
| Faculty - Click here to recommend new topics in Meida & Entertainment |
| News |
| Indias media moment is about TV and mobile convergence, not replacement By The Economic Times; Sep 29 2026 |
| Under-18 social media ban: Centre plans changes to IT intermediary rules By Business Standard; Sep 29 2026 |
Wish to see more News? Click the link below:
|